The Salary Cap Map
Published on October 23rd, 2026Written By: Dave Manuel
Baseball's labour deal expires on December 1, and for the first time since 1994 the owners have put a salary cap on the table. On October 22, Mat Ishbia, a minority owner of the Chicago White Sox who also owns the Phoenix Suns, said publicly that he thinks baseball needs one, with a minimum payroll to go with it. That got me thinking about how differently the four big North American leagues handle money. Three of them cap payrolls and one does not, and even the three that do it all do it differently. So I went through the rulebooks of the NFL, NBA, NHL and MLB and put them side by side.
The Rulebook Grid
Every cap system answers the same handful of questions. How much of the money do the players get? Is there a ceiling, and can a team go over it? Is there a floor? What happens to a team that spends too much, and what happens to one that cheats? This is how each league answers them.
| NFL | NBA | NHL | MLB | |
|---|---|---|---|---|
| System | Hard cap | Soft cap, tax and two aprons | Hard cap with a floor | No cap. Luxury tax only |
| Since | 1994 | 1984-85 | 2005-06 | Tax since 2003 |
| Players' share | About 48% of all league revenue, up to 48.8% | 49% to 51% of basketball revenue | 50% of hockey revenue | None guaranteed |
| Can a team go over? | No | Yes, using exceptions | No, with narrow injury relief | Yes, and pay tax |
| Floor | No yearly floor. 90% of the cap in cash over three or four years | 90% of the cap | About 74% of the cap | None |
| Tax | None | Per dollar over the tax line, rising in brackets | None | 20% to 110% of the overage, by tier and repeat status |
| Top player salary | No limit | 25%, 30% or 35% of the cap, by years in the league | 20% of the cap | No limit |
| Longest contract | No limit | Five years | Seven years, six with a new team | No limit |
| Rookie pay | Fixed scale since 2011 | Fixed scale by draft slot | Capped entry-level deals | No scale |
| If you cheat | Lost picks, fines, lost cap space | Fines, lost picks, suspensions | Fines, lost picks, rejected contracts | No cap to cheat |
RULES UNDER THE CURRENT AGREEMENTS: NFL THROUGH 2030, NBA THROUGH 2029-30, NHL THROUGH 2029-30, MLB EXPIRING DECEMBER 1, 2026.
NFL: The Wall
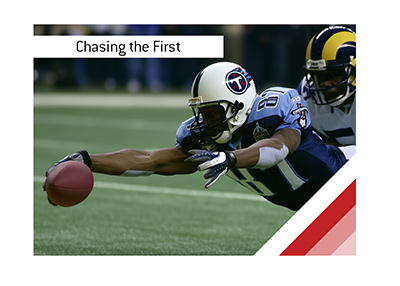
The NFL has the purest cap of the four. Players get roughly 48 per cent of all league revenue, which can rise to 48.8 per cent under a media bonus in the current deal; their benefits come out of that share first, and what is left, divided by 32, is the cap. It started in 1994 at $34.6 million a team and went past $300 million for the first time in 2026, at $301.2 million. Nobody goes over it, ever.
The way teams live with it is timing. A signing bonus is spread evenly over up to five years of a contract, so a team can pay a player now and count the money later. When that player is cut or traded, every dollar not yet counted lands on the books at once. That is dead money, and it is why NFL teams sometimes carry millions for players who are no longer on the roster.
The rule people get wrong: there is no yearly salary floor. A club can sit well under the cap in any one season. What it must do is spend at least 90 per cent of the cap in cash across a set window of three or four seasons, and if it falls short, it simply pays the difference to its own players. There is no fine and no lost pick.
NBA: The Soft Cap
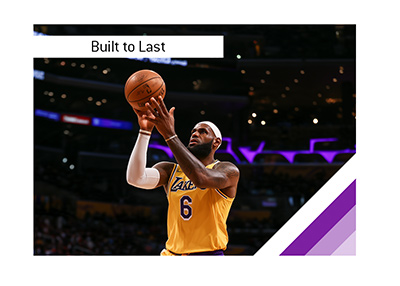
The NBA cap is the oldest of the modern ones. It was agreed in 1983, when many teams were losing money, and first applied in 1984-85 at $3.6 million. Today players get between 49 and 51 per cent of basketball-related income, and the cap for 2026-27 is $164.961 million.
The rule people get wrong: being over the NBA cap is completely normal. The cap mainly limits how much a team can spend signing other teams' free agents. A team can re-sign its own stars past the cap using Bird rights, named after Larry Bird and part of the original 1983 deal, and add players with exceptions such as the mid-level exception. The real limits sit above the cap: a tax line and two aprons, which I come back to below.
NHL: Ceiling and Floor
The NHL cap arrived after the league cancelled the whole 2004-05 season to get it. It started in 2005-06 at $39 million. Players get 50 per cent of hockey-related revenue, and the league sets a midpoint from that share: the cap is 15 per cent above it and the floor 15 per cent below. For 2026-27 that means a cap of $104.0 million and a floor of $76.9 million. No player can earn more than 20 per cent of the cap, which is $20.8 million this season.
The rule people get wrong: long-term injured reserve does not take a player's salary off the books. His cap hit still counts. The team is simply allowed to go over the cap by up to that amount to replace him while he is out. For years teams used that to ice rosters well over the cap in the playoffs once injured players returned. The new deal that took effect on September 16, 2026 closes it: from the 2027 playoffs, the 20 players dressed for each game must fit under the regular-season cap.
MLB: The Tax
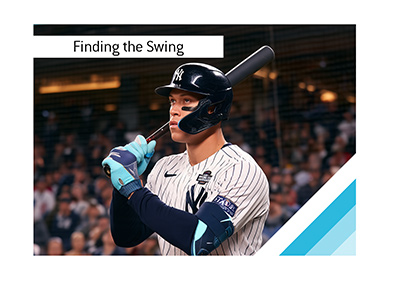
Baseball has no cap and no floor. A team can spend whatever it likes, and the only brake is the competitive balance tax, which charges a percentage of every dollar over a threshold. The threshold for 2026 is $244 million. A first version of the tax ran from 1997 to 1999, and the current one began in 2003. I covered how the tax works, and who has paid it, in The Luxury Tax Receipts.
The rule people get wrong: the luxury tax money does not just go to small-market clubs. The bigger transfer from rich teams to poor ones is revenue sharing, under which every club puts 48 per cent of its net local revenue into a pool that is then divided up so that the big markets pay in more than they get back.
When Teams Got Caught
A cap is only as strong as the punishment for getting around it. These are the cases that set the standard in each league.
| CLUB | LEAGUE | YEAR | WHAT THEY DID | WHAT IT COST |
|---|---|---|---|---|
| San Francisco 49ers | NFL | 2000 | Undisclosed side deals with players during the 1990s | $300,000 team fine, two draft picks, $600,000 in fines for two former executives |
| Denver Broncos | NFL | 2001 and 2004 | Two separate cases of deferred pay that broke the rules | $968,000 and a third-round pick, then $950,000 and another third-round pick |
| Washington and Dallas | NFL | 2012 | Loading salary into the uncapped 2010 season | $36 million and $10 million of cap space taken away over two seasons |
| Minnesota Timberwolves | NBA | 2000 | A secret deal promising Joe Smith a future contract | $3.5 million fine, five first-round picks (two later returned), Smith's contracts voided |
| Los Angeles Clippers | NBA | 2026 | Arranging outside endorsement money for Kawhi Leonard | $30 million fine, five first-round picks, owner Steve Ballmer suspended for a year |
| New Jersey Devils | NHL | 2010 | A 17-year contract for Ilya Kovalchuk built to shrink the cap hit | Contract rejected, $3 million fine, a first- and a third-round pick |
| Vancouver and Florida | NHL | 2019 | Roberto Luongo retiring with years left on a front-loaded deal | About $3.0 million and $1.1 million of dead cap a season for three seasons |
The Clippers penalty is among the heaviest the NBA has ever handed out. The league found that the team had arranged off-court deals for Leonard with four companies that did business with the club, the largest a $28 million endorsement contract. Ballmer has since accepted the penalties. The Kovalchuk case is the one that changed hockey: the league and the players agreed new rules on long contracts in the settlement, and the cap recapture charge that later hit Vancouver and Florida over Luongo came out of the 2013 deal that followed.
The Ceiling and the Floor
Most explainers talk about the ceiling. I think the floor matters just as much, because it is the line that stops a team from collecting its share of league revenue and spending almost none of it on players. The chart shows each league's floor as a share of its own cap, which stays fairly steady from year to year even as the dollar figures grow.
The NHL floor is the tightest pairing of the four. Because both lines are set 15 per cent either side of the same midpoint, the most any team can spend is about 1.35 times the least any team can spend. In the NBA the floor is higher, at 90 per cent of the cap, but teams can go a long way over the cap, so the gap between the cheapest and most expensive payrolls is wider.
That is exactly the fight in baseball now. On May 28, 2026 the owners formally proposed a cap of $245.3 million and a floor of $171.2 million for 2027, with players getting 50 per cent of revenue, in a seven-year deal. Measured against 2026 payrolls, eight clubs would have had to cut and twelve would have had to add; only ten were already inside the range. The players have always refused a cap. Their own proposal asked for something closer to a floor without a ceiling: a tax on clubs whose payroll falls below half of the luxury tax threshold, and penalties for clubs that do not spend their revenue-sharing money on players. Bruce Meyer, the union's interim head, put it this way: "Billionaire owners are not seeking to cap their profits or asset values, only player salaries."
Ishbia's comments this week came from the other side of that table. "I do believe that it's been proven that having a salary cap does make sense for the business," he said, adding that "in the NBA, there's also a minimum you have to pay." He also said that as a minority owner he has no say in the talks. I went through the deadline and where the two sides stand in The Strike Clock, and through every past stoppage in Every MLB Work Stoppage in History.
The Apron Ladder
A cap is not always a single line. In two of the four leagues, spending more works like climbing a staircase: each step costs more than the last, and the top step takes tools away. In the other two there is no staircase at all, just a wall.
| Under the cap | Can sign other teams' free agents with cap space. |
| Over the cap | Perfectly legal. Re-sign your own players with Bird rights, add others with exceptions. |
| Over the tax line | Pay tax on every dollar over, in brackets. Since 2025-26 the rate starts at $1.00 per dollar and climbs; a team that has paid in three of the previous four seasons pays $2.00 more in every bracket. |
| Over the first apron | Lose some exceptions, and can take back no more salary in a trade than it sends out. |
| Over the second apron | No taxpayer mid-level exception, no combining salaries in trades, no sending cash, and the first-round pick seven years out is frozen. Stay up there in two of the next four years and that pick drops to the end of the round. |
| STATUS | BASE | +$20M | +$40M | +$60M |
|---|---|---|---|---|
| First year over | 20% | 32% | 62.5% | 80% |
| Second year in a row | 30% | 42% | 75% | 90% |
| Third year or more | 50% | 62% | 95% | 110% |
AT $40 MILLION OVER, THE CLUB'S HIGHEST DRAFT PICK ALSO MOVES BACK TEN PLACES.
The second apron is the important one. It does not stop a team from spending, but it takes away almost every tool for improving a roster once it gets there, so in practice it works close to a hard cap. The first apron dates back to the 2011 deal. The second arrived in the 2023 deal, aimed at the most expensive payrolls in the league, and the same deal made the first apron much tougher.
Baseball's staircase is steeper but has no top step. A team that stays over the threshold year after year and goes $60 million past it pays 110 per cent on those last dollars, so every extra dollar of salary up there costs more than two. At $40 million over, its top draft pick also drops ten places. The fourth tier was added in 2022 and is widely called the Cohen tax, after the Mets owner it was aimed at.
The NFL and NHL have no staircase. The cap is a wall, and the only movement is in timing: when money counts, not whether it counts.
The Parity Test
This is the question I really wanted answered. Owners sell caps as a way to give every team a chance. So I counted how many different teams won the title in each league in the 20 seasons before its cap arrived, in the first 20 seasons with it, and in the most recent 20, and how often the champion repeated.
| LEAGUE | PERIOD | SEASONS | DIFFERENT CHAMPIONS | REPEATS |
|---|---|---|---|---|
| NFL | Before the cap | 1974-1993 | 7 | 4 |
| NFL | First 20 with the cap | 1994-2013 | 13 | 2 |
| NFL | Last 20 | 2006-2025 | 13 | 1 |
| NHL | Before the cap | 1985-2004 | 10 | 3 |
| NHL | First 20 with the cap | 2006-2025 | 13 | 3 |
| NBA | Before the cap | 1965-1984 | 9 | 2 |
| NBA | First 20 with the cap | 1985-2004 | 6 | 9 |
| NBA | Last 20 | 2007-2026 | 12 | 3 |
| MLB | No cap | 1974-1993 | 13 | 3 |
| MLB | No cap | 2006-2025 | 12 | 1 |
The hard caps line up with what the owners promised. The NFL went from seven different champions in the 20 seasons before 1994 to thirteen in the 20 after it, and the NHL from ten to thirteen. Repeat champions have become rare in football: one in the last 20 seasons, the Chiefs in 2022 and 2023.
The NBA goes the other way. Its first 20 seasons under the soft cap produced only six different champions and nine repeats, the era of the Lakers, the Celtics, the Pistons, the Bulls, the Rockets and the Spurs. A cap with exceptions for re-signing your own players turned out to be very good at keeping great teams together. The spread came later: twelve different champions in the last 20 seasons.
And baseball, with no cap at all, has had twelve different champions in the last 20 seasons, as many as the NBA and one fewer than the NFL and NHL. It produced thirteen in the 20 seasons from 1974 to 1993. So I would not say a cap is what makes a league competitive. Caps arrived alongside free agency, expansion and bigger playoffs, and all of those spread titles around too. What the record does show is that a hard cap makes it very hard to stay on top, and a soft cap does not.
What It Means for Bettors
In a hard-cap league, check who left. A champion in the NFL or NHL almost always has to let good players go to stay under the wall, and the futures price on a defending champion does not always reflect that. One NFL repeat in 20 seasons is the base rate.
In the NBA, check where a contender sits against the aprons. A team at the second apron has very few ways to improve during the season and a frozen draft pick to worry about. That shapes what it can do at the deadline and the summer after.
In baseball, payroll is not a title. The biggest spenders are always well priced in futures, and the record says twelve different clubs have won in the last 20 seasons. Price the roster, not the payroll.
Elsewhere
The four big leagues are not the only models. Three others show how far the idea stretches.
| MLS | Salary budget of $6,425,000 a club in 2026, with no player charged more than $803,125 against it. Up to three Designated Players can earn anything, the rule that brought David Beckham to Los Angeles in 2007. Allocation money ($2,125,000 targeted and $3,280,000 general) tops it up. |
| WNBA | The 2026 deal, ratified in March for seven seasons, raised the cap from $1.5 million to $7.0 million a team, with a top salary of $1.4 million. |
| Premier League | No fixed cap. From 2026-27 a club's squad costs are limited to 85 per cent of its football revenue plus profit on player sales, with a levy above that and points deductions further up. A true league-wide cap tied to the bottom club's TV money was proposed and dropped for lack of support in November 2025. |
One Last Word
Put the four rulebooks side by side and baseball is clearly the outlier. Every other major league decided long ago that teams needed both a ceiling and a floor, and argued only about how hard to make them. Baseball fought one off in 1994, at the cost of a World Series, and has used a tax ever since.
Whether that changes this winter is for the owners and the players to work out. What I took away from the numbers is that a cap changes how a league competes more than whether it does. The hard caps produced more different winners and fewer dynasties. The soft cap produced dynasties first and spread out later. And the league with no cap at all has spread its titles about as widely as anyone.
Notes: dollar figures are for the 2026 NFL and MLB seasons and the 2026-27 NBA and NHL seasons unless dated otherwise; percentages of the cap are the more durable measure and are calculated from those figures. The NFL players' share is the band set in the current CBA (48 to 48.5 per cent, up to 48.8 per cent with the media bonus). The NHL floor is 85 per cent of the midpoint and the cap 115 per cent, so the floor is about 73.9 per cent of the cap. NBA tax rates are the rates in effect from 2025-26; the 2023-24 and 2024-25 rates were different. MLB rates are base rate plus surcharge, as set in the 2022 CBA. The 49ers 2000 penalty was described at the time as the team's fifth selection in 2001 and third in 2002. The Timberwolves later had two of the five forfeited picks restored. The owners' May 2026 proposal figures are as presented; negotiations were ongoing when this was written in October 2026.
Championship counts use the Super Bowl winner by season (1974 to 2025), the NBA champion (1965 to 2026), the Stanley Cup (1985 to 2025, no Cup in 2005) and the World Series (1974 to 1993 and 2006 to 2025). Relocated franchises count once. Repeats are seasons in which the defending champion won again inside the same window.
18+. Betting involves risk. Nothing here is a prediction or financial advice. Please gamble responsibly.